


Gold-to-Silver Ratio Breaks 100
Chart of the Week #51
While everyone’s been focused on gold breaking out to new highs above $3,300, most investors have been ignoring its less glamorous cousin—silver. And that’s exactly why it deserves a closer look right now.
The Gold-Silver Ratio (GSR) recently climbed to 103, marking its second-highest level in recent decades—just slightly above the 1991 peak and trailing only the unprecedented spike of 125 during the 2020 COVID panic. Take a look at this week's chart below.
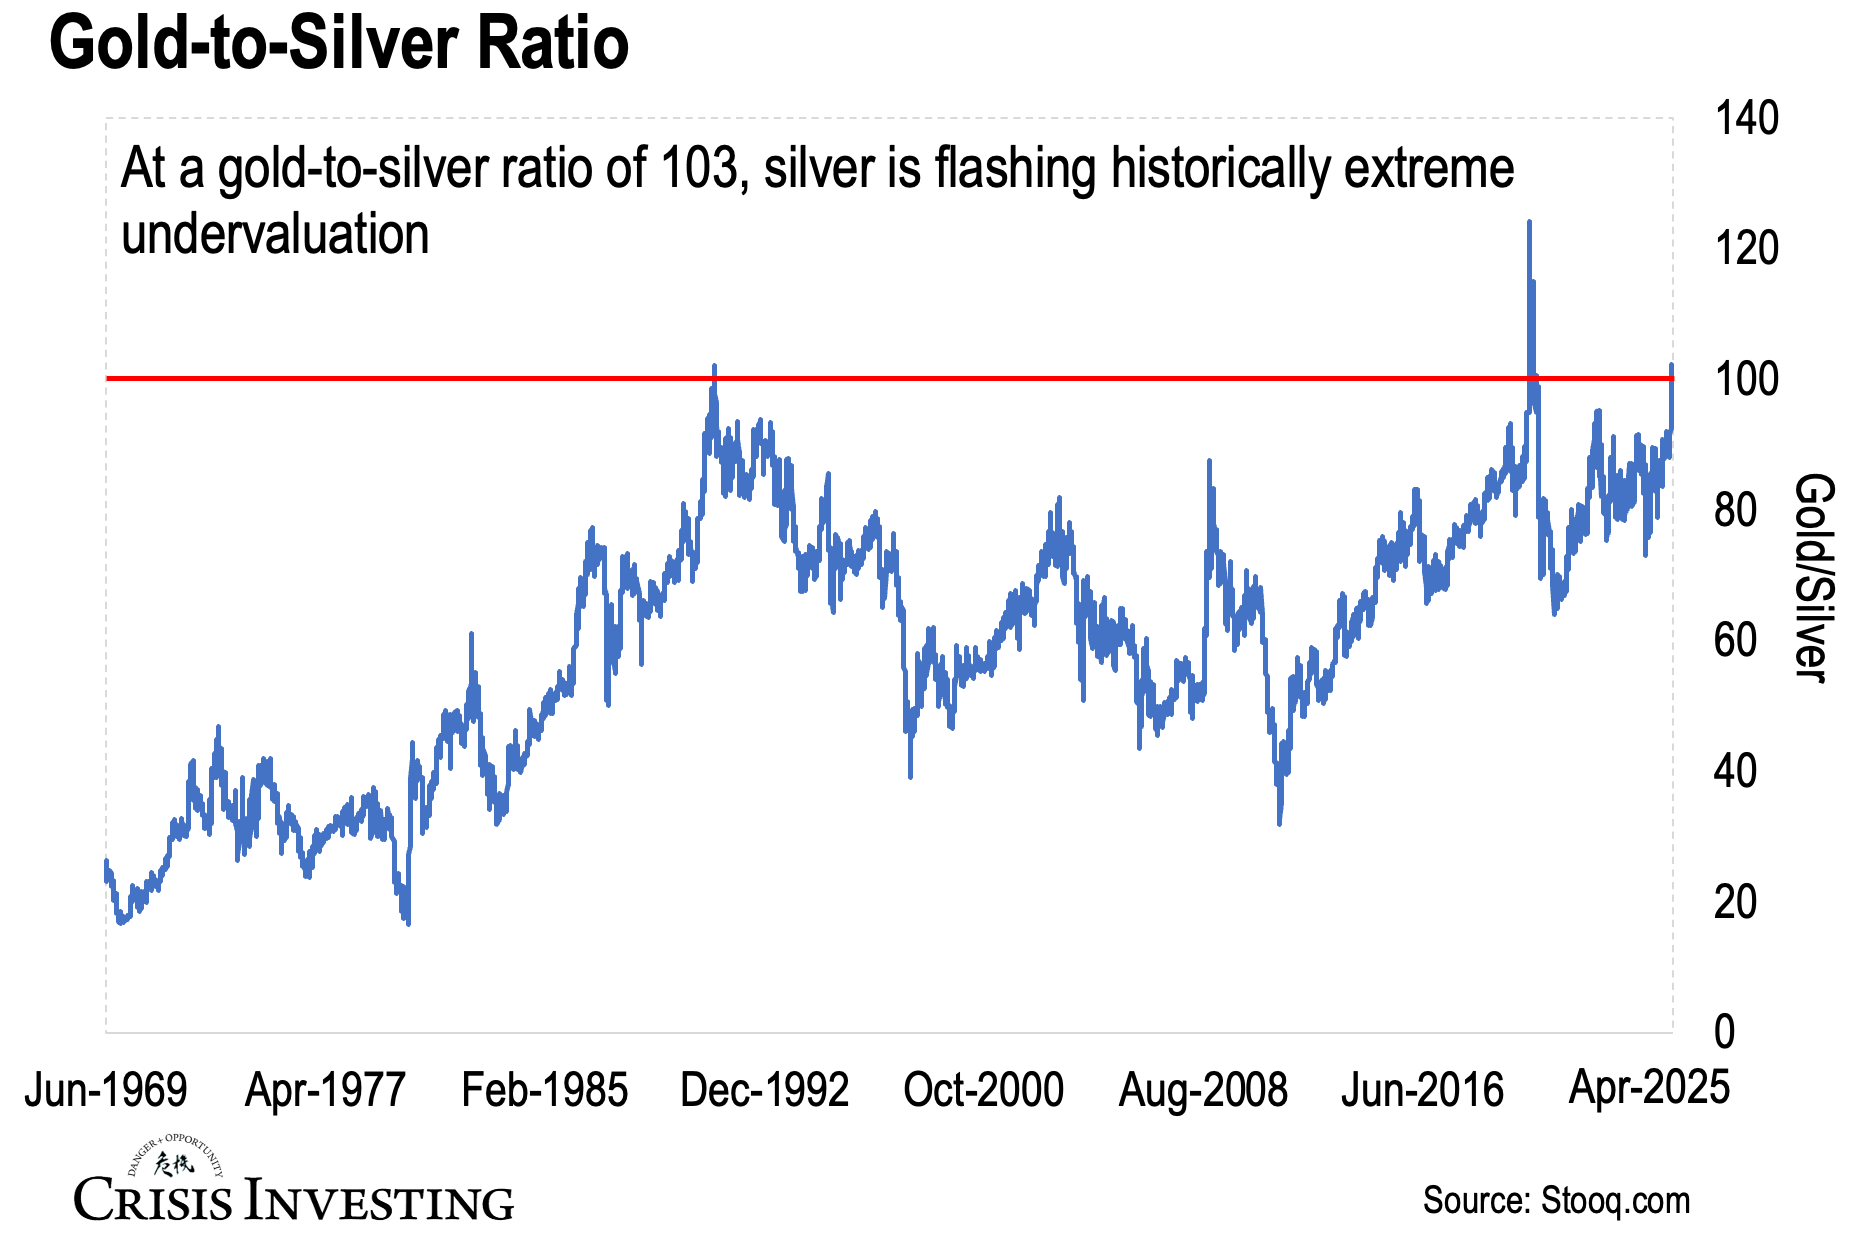
Note: The GSR tells you how many ounces of silver it takes to buy one ounce of gold. So a ratio of 103 means it takes 103 ounces of silver to match the value of a single ounce of gold.
Historically, the gold-silver ratio averages around 60, and readings above that have often signaled silver is undervalued—at 103, we’re deep into that territory.
That’s why extreme readings above 100 are rare—and, as you can see from the chart above, they usually don’t last long.
And while I don't have precise data going back centuries, I recently stumbled upon a graphic circulating on X that really drives home just how unusual today’s silver (under)valuation is. Although I haven't verified every data point myself, it broadly aligns with historical accounts. Take a look.
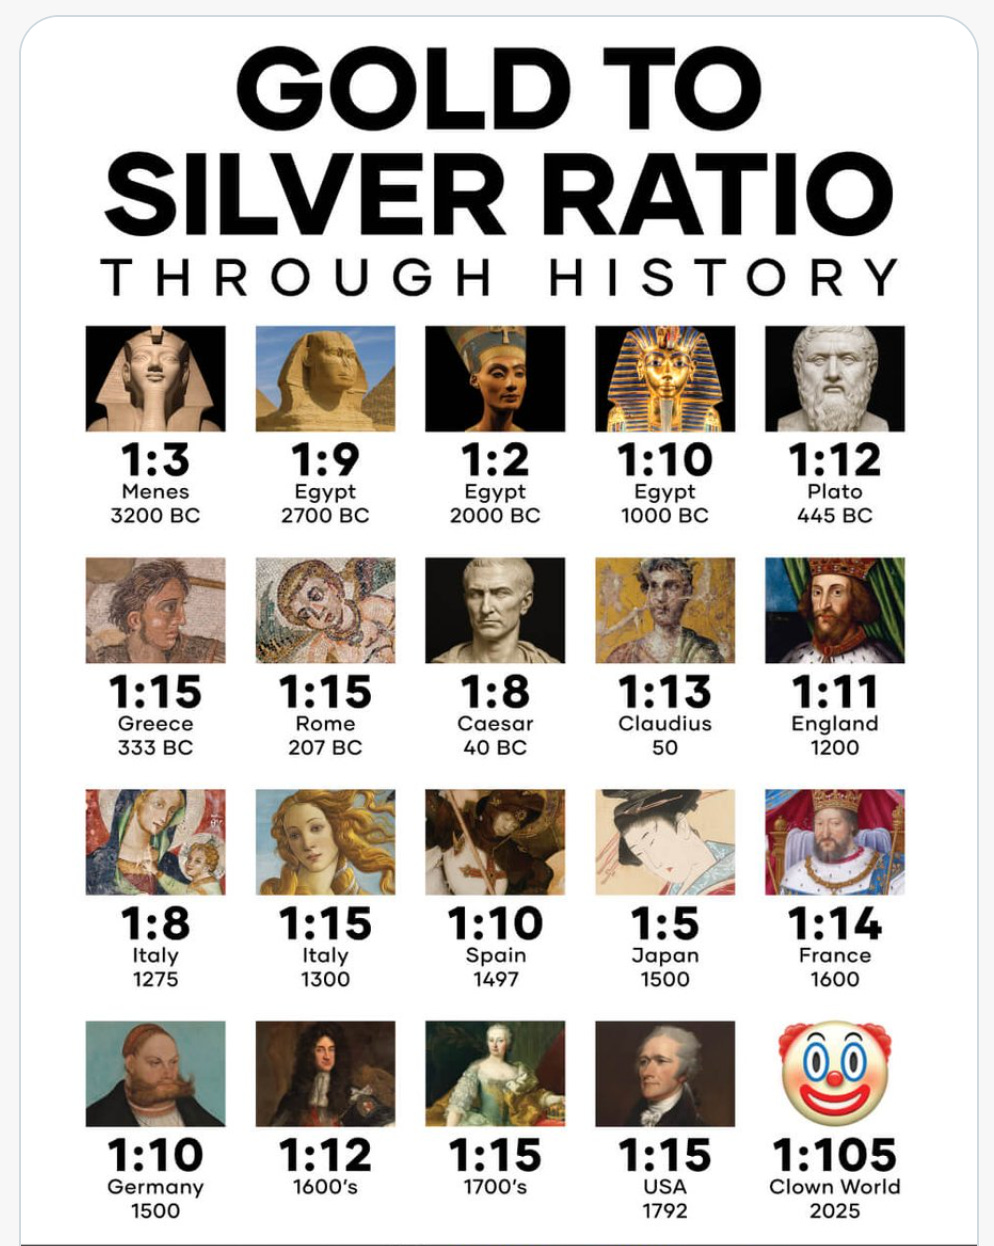
The key thing to know is this.
Historically, extreme ratio levels—like 103 right now—have often preceded significant reversals, with silver typically outperforming gold as the ratio reverts toward its average. A clear recent example was March 2020: after spiking above 120, silver more than doubled within just five months, substantially outperforming gold.
Why does this happen?
First, the silver market is relatively small—roughly a tenth the size of gold's—which means even modest capital inflows can move the price dramatically.
Second, silver tends to be more volatile, often behaving like a leveraged version of gold. During bull markets, it usually outpaces gold significantly.
Third, unlike gold, about half of silver's demand is industrial. As economic activity rebounds after downturns, this industrial usage picks up, providing additional price support.
Here’s the bottom line. With the gold-silver ratio at such an extreme level, silver looks set for a potential catch-up rally. If the ratio just moves back to its long-term average of 60, silver would need to rise about 70% relative to gold. That’s an increase of nearly $23 per ounce from current levels. And if gold keeps climbing too, silver’s upside could go from big to explosive.
Sure, extremes can last longer than you'd expect, and history doesn’t guarantee what comes next. But at these levels, silver’s risk/reward looks pretty compelling.
Enjoy the rest of your Easter weekend—whether you're celebrating or just relaxing, I hope it's a good one.
Lau Vegys
The bullion banks lost control of gold futures due to massive central bank physical gold purchases but still control the silver futures action. They will eventually loose the silver futures when physical silver shortages overwhelm them and force them to cover their massive shorts. It is a when, not an if question.
Great historical perspective on the GSR and what it typically portends. Silver is pretty ignored or hated by the masses right now, seems like it usually wears out and exasperates everyone as much as possible then it explodes for those once-in-a-decade amazing moves. Locked and loaded with some silver juniors and some majors/mid-tiers, and some AGQ for leverage to the spot price. Fingers crossed, good luck all